
Viruses rarely appear out of nowhere. Before an outbreak there are usually signs: changes in vegetation, alterations in climate, explosions in the rodent population or movements of animals towards inhabited areas. The problem is that these signals are usually dispersed, hidden among millions of data that are impossible to interpret with the naked eye. And that’s where NASA comes in.
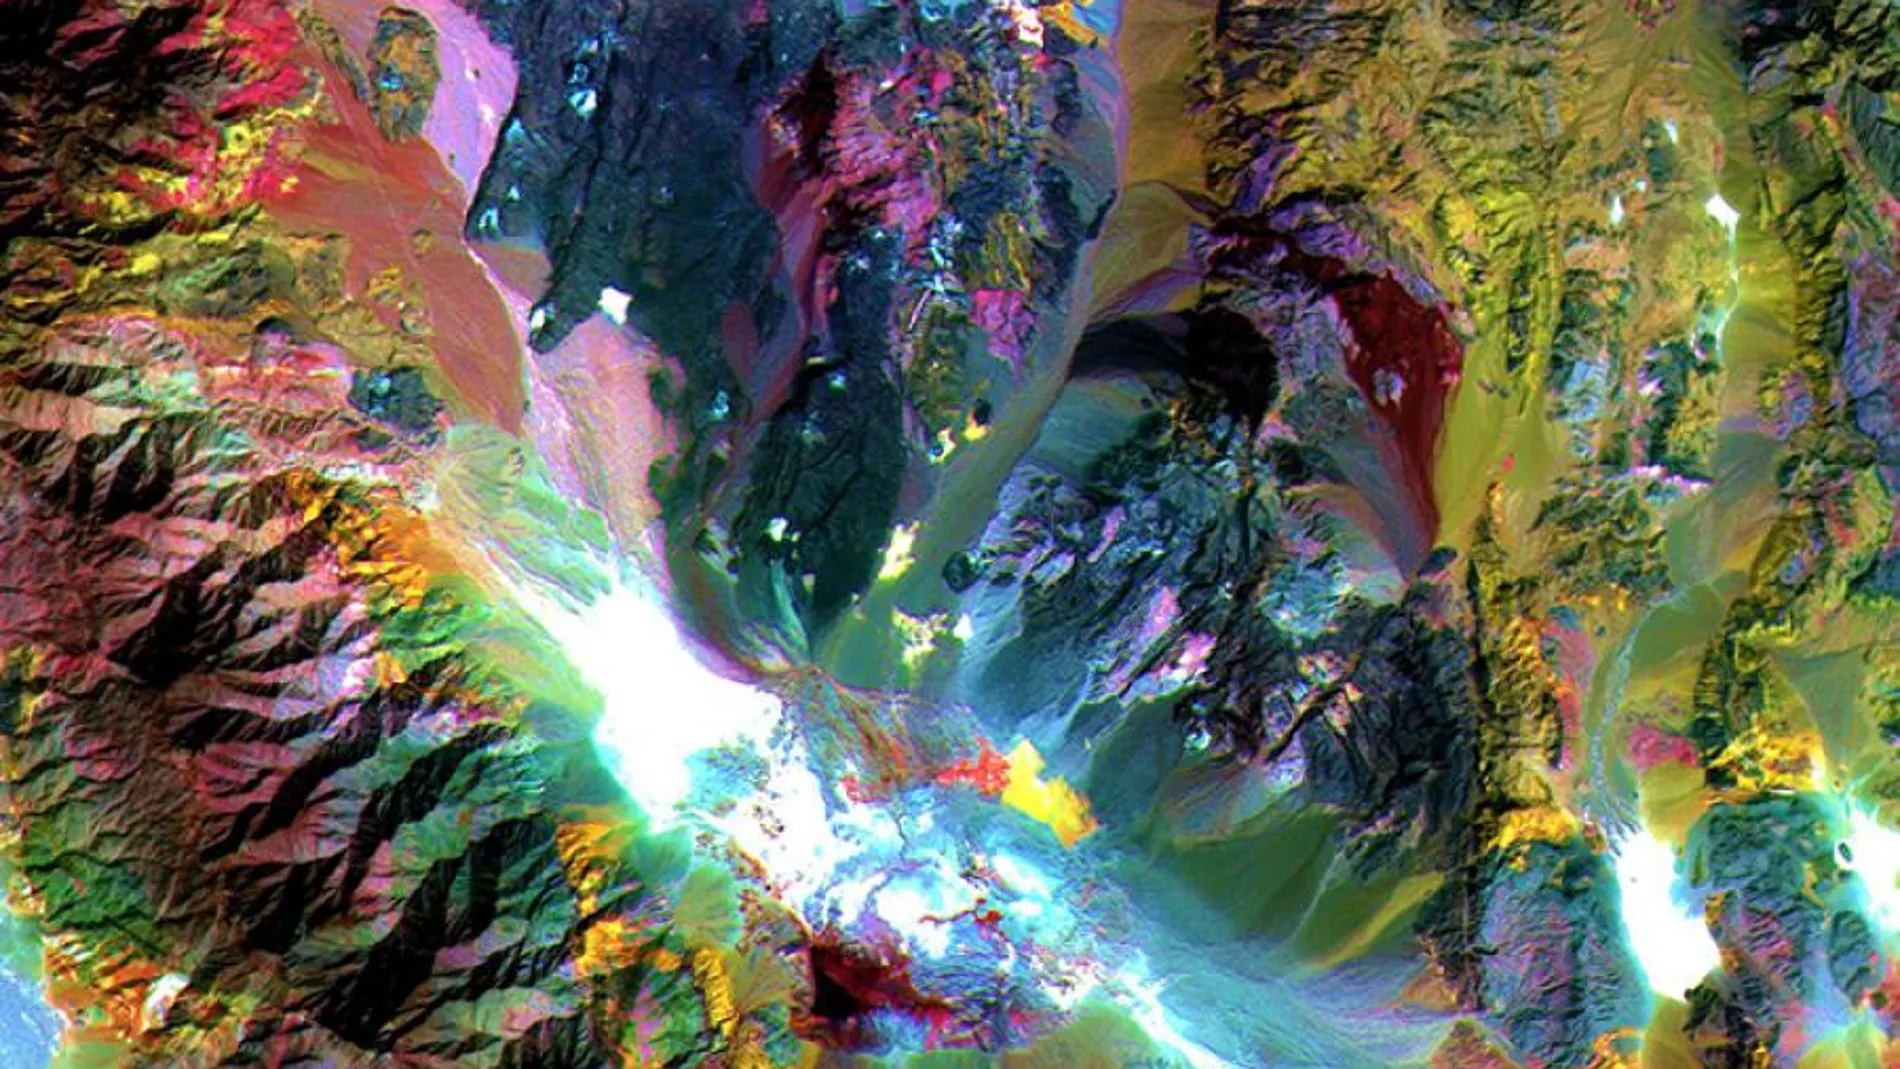
A new project by the US space agency has managed to create hantavirus risk maps by combining satellite images, climate data and ecological models. The idea is not to directly detect the virus from space, but rather something much more complex: identify the environmental conditions that favor its appearance. before human cases increase.
Hantavirus is a family of viruses transmitted mainly by rodents. Humans can become infected by inhaling particles from urine, saliva or dried excrement of infected animals. In some cases it causes hemorrhagic fever; in others, an extremely severe pulmonary syndrome that can be fatal.
The disturbing thing is that its expansion is closely linked to the environment. More rain means more vegetation. More vegetation means more food for rodents. And more rodents increase the likelihood of contact with humans. It is a complex ecological chain that can begin months before the first patients appear.
To reconstruct that pattern, The scientists used data from Earth observation satellites capable of measuring soil moisture, temperature, precipitation and vegetation growth. These include missions such as Landsat and MODIS, which allow us to observe how the landscape changes in almost real time.
The goal is to create predictive models. Not static maps, but systems capable of anticipating which regions could become risk hotspots weeks or even months before the virus spreads among the population. The logic of this project makes one think of “epidemiological meteorology.” Just as a satellite can detect favorable conditions for a hurricanethese systems seek to detect the ecological scenarios where an outbreak is most likely to appear.
According to NASA, the work combines environmental information with historical records of infections and studies on rodent behavior. The result is a cartography that can help health authorities and rural communities better prepare for possible outbreaks.
The project also reflects a broader change in the way we understand infectious diseases. For decades, epidemiological surveillance focused almost exclusively on hospitals and laboratories. But Many scientists are beginning to consider that part of public health plays out much earlier, in ecosystems.
Deforestation, increased temperatures and climatic alterations are modifying the distribution of numerous animal species. And with them, the viruses they carry also change. In that context, Observing the Earth from space is no longer just a climatic or geological issue and is also becoming a medical tool..
There is also a particularly interesting detail: the satellites do not “see” the virus. What they observe are their indirect traces on the landscape. An anomalous increase in vegetation after heavy rains, for example, may indicate future growth in mouse populations. And that growth can translate months later into an increase in human infections. Is a different way of understanding epidemics: not as isolated events, but as phenomena deeply connected to the functioning of the planet.