
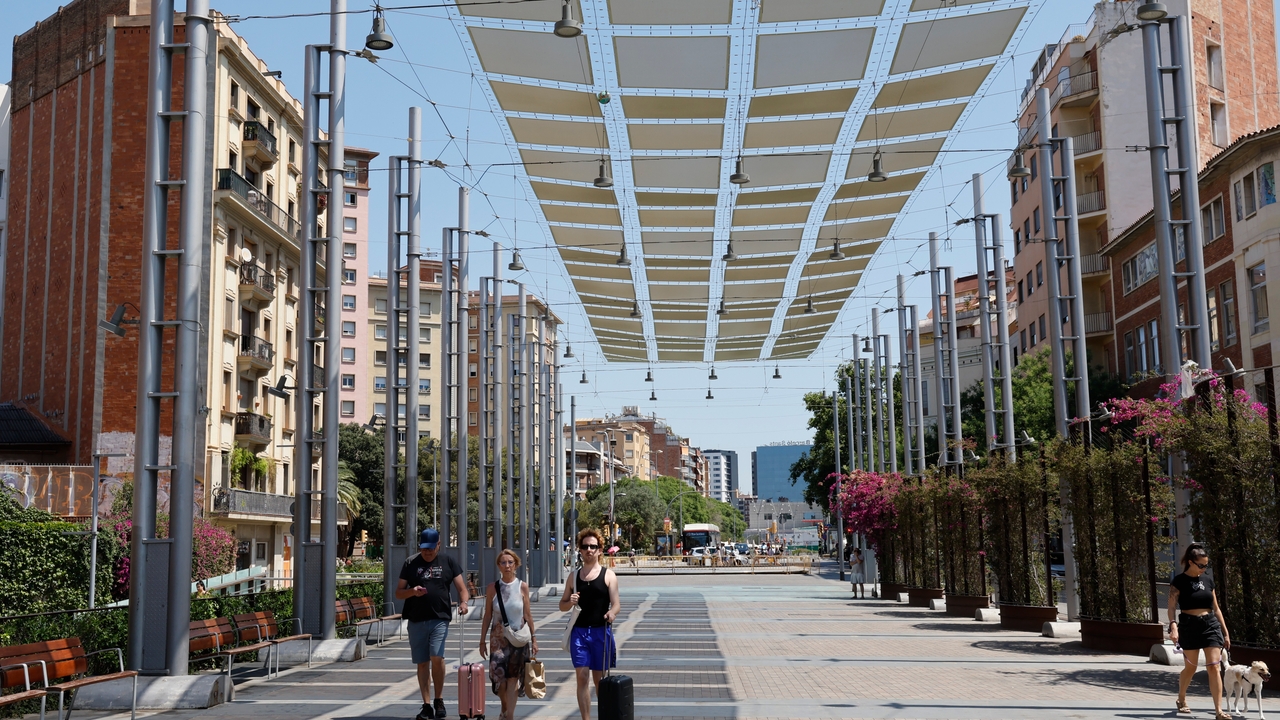
In full and suffocating summer in large part of Spain, having a shadow under which to shelter can be a very precious good. Wouldn’t it have a ‘google maps’ of the shadows to know where they are at every moment of the day and what size are? Something like that must have thought of the programmer Ted Piototskithat in 2020 began the development of an interactive map that fulfills that function.
Shademap.app It is a kind of ‘Google Maps’ that allows you to visualize on your mobile or computer, with remarkable precision, The shadows projected by buildings, trees, mountains or other land accidents anywhere on the planet any time of the day.
This interactive map, accessible from any browser And without the need to register, it generates in real time a simulation of the movement of the sun and the shadows that it produces. Its operation is based on Public Geospatial Data -As the SRTM elevation models or the OpenStreeMap buildings that the system uses to draw the trajectory of the sun and project shadows on the ground. The calculation is pixel to pixel: if a simulated solar ray clashes with an obstacle before reaching the ground, that pixel is marked as a shadow.
Its use is very simple. When accessing, shademap te geolocalizes And it shows a zenith view of the area in which you are, as in any other interactive map. It has a Location search engine and, at the bottom, the current date and time are presented, options to choose another and A slider with which you can move over 24 hours a day selected to see the behavior of the shadows. It is a truly curious effect: shadows lengthen or shorten on the map in real time, adapting to geography and solar orientation of that moment.
In addition to the basic mode -which shows the shadows as is, there are two other visualization modes: Hours under the sunthat color the zones according to the number of sun hours they receive throughout the day, and Annual sunlightwhich visualizes the accumulated sun exposure over a whole year (average of hours of sun per day), as well as the SOLAR ENERGY ACCUMULATED IN KWH/M² a year at each point on the map. This last functionality is useful for assessing the Photovoltaic potential of roofs or surfaces. You can also rotate the view in three dimensionszoom fluently and export the results as geotiff files or share links with the current view.
Shademap allows even add trees virtually About the map to see what shadow they would generate, or Import GPS routes (GPX/kml format) To study how many hours of shade would have a walking or bicycle route.
The application can be useful for a wide variety of users. Urbanists, Architects and Professionals of Renewable Energies They can simulate the shadow of new buildings or calculate how much light a facade receives throughout the year. But it is also practical for tourists that they want to avoid sun rides, to hikers that plan routes in summer or even for Organize an outdoor wedding and hit with the location of the tables.
The Free version It offers more than acceptable precision, but paying is accessed to high resolution data in specific areas, with Lidar models or aerial photogrammetry that reach the 30 centimeters of precision.